Monitoring Costs
Contents
Monitoring Costs#
Overview
Teaching:
Exercises:
Questions:
Objectives:
Overall Costs analysis#
In the Azure portal hamburger menu, navigate to the Cost Management + Billing and click on it.
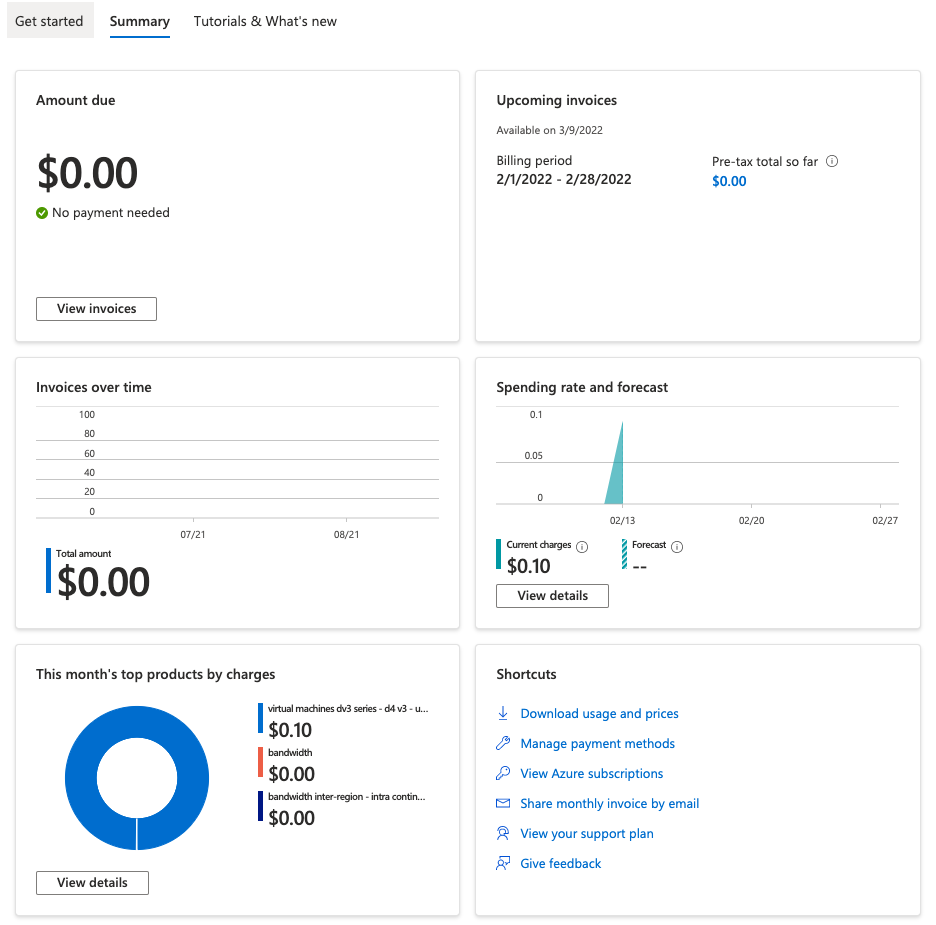
This will take you to the Billing account page. This page provides an overview of the costs for your overall account. You will see the Amount due, Upcoming invoices (For the Billing period), past invoices, Spending rate and forecast, and This months top product charges.

In the left hand menu click the Cost analysis tab.
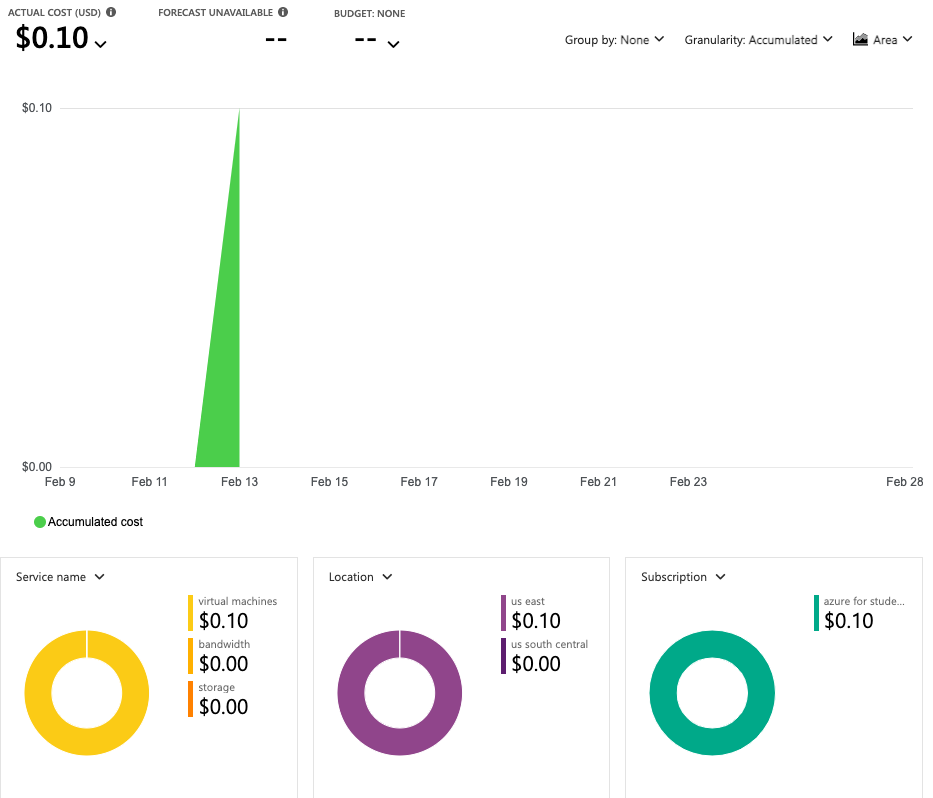
Here you will see the actual and forecasted cost as well as a breakdown by service name, Location (zone), and subscription.
A time series graph is also provided to give a visual of curent and forecasted cost for the end of the billing period.

Note: These values may all be zero if there are no resources allocated yet in this account. Also, in this example there is only one item under service name.
Costs analysis for Resource Groups#
Similarly, you can see a cost breakdown for a Resouce Group and resources contained in it by navigating to the Resource Groups tab in the hamburger menu.
Once in the Resource Group page, click on the Resource Group you are interested in.
In the left hand menu of the Resource Group page, click on the cost analysis tab.
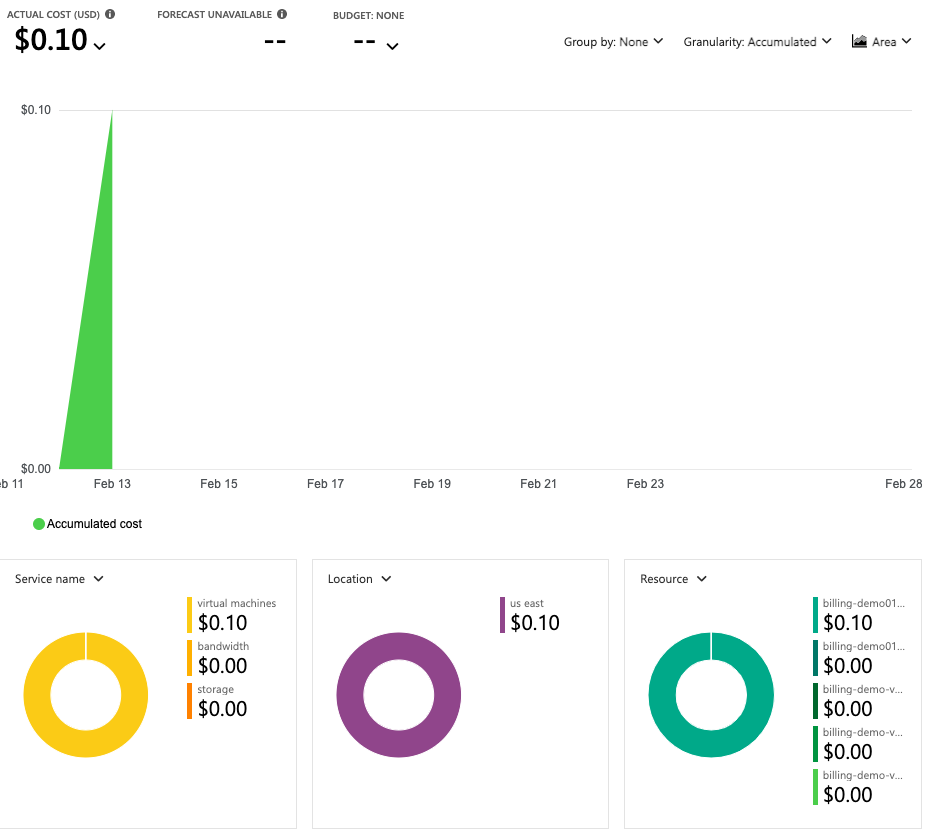
Here you will see the actual and forcasted cost of the resources in your Resource Group.
You will also see a breakdown of costs by Service name, Location, and Resource in doughnut charts.
The doughnut charts are interactive and by moving your curser over the chart you can drilling down to look at costs for individual resources.
A time series graph is provided to give a visual of curent and forecasted costs through the end of the billing period.
The forecasted information in the time series graph will help plan adjustments to your resource allocation to meet your cost requirements.

Note: These values may all be zero if there are no resources allocated yet in this account. Also, in this example there is only one resource listed.

